

The Meta ads experiment with Unstable Orbits has concluded. In this post I’m going to present actual numbers, so you can see how much money I spent and how much I can expect to receive in royalties. A later post (not sure when) will delve into specific ad creatives.
Summary
I started the experiment with the lowest possible expectations: anything above zero sales would count as success, and even zero sales would tell me something.
The goal was to try to answer these questions:
- Which adverts work best for this book?
- Does the book’s blurb convince people to buy?
I’ve made some progress on the first question (for a later post). I don’t think I have enough data to answer the second question.
Show me the money
The ad campaign budget specified an average spend of £5 per day over the length of the campaign: from start of August 27, 2025 to end of September 26, 2025 (in British Summer Time, UTC+1). Actual ad spend: £154.95.
As I mentioned in the previous post, there’s a mismatch in click-through numbers reported by Amazon and Meta. And while Amazon does record sales that occurred directly from ad clicks, there’s no way to know whether someone independently bought a book after seeing the ad.
Let’s go through everything anyway, because Numbers are Fun™.
In the land of Meta:
- Impressions (ads shown to eyeballs): 36,964
- Reach (distinct accounts that saw ads; estimated): 23,435
That’s about 1.58 impressions per account. One way of interpreting this: of the accounts that saw my ads, about half saw one ad, and about half saw two ads.
- Results: 929 link clicks
- Click-through rate (CTR): 2.51%
I’ll dig into the CTR of each ad in a later post. Supposedly anything above 2% CTR is “good”.
Interestingly Meta has another metric “Clicks (all)” that reports “The number of clicks, taps or swipes on your ads” and this is a bit bigger: 1,010.
You’d think, wouldn’t you, that on the Amazon side I’d see the same number of clicks reported. Let’s see!
In the land of Amazon:
- Click-throughs: 1,215 (“A click on an ad that directs the user to a destination outside of the creative”)
- Detail page views: 1,154 (“The number of views of the advertised product’s detail pages on Amazon”)
The click-through URL of each ad was the Amazon detail page, so these two numbers should be the same. I can imagine a few reasons for inconsistencies, like network problems. Neither number is similar to either of Meta’s numbers.
(I should probably trust Meta’s numbers to be internally consistent, and Amazon’s numbers to be internally consistent, and not cross-pollinate to say things like “the real CTR is Amazon’s 1,215 divided by Meta’s 36,964, or 3.3%” in an attempt to make my numbers as big as possible.)
How many of those 1,154 detail page views resulted in sales?
- Purchases: 8
That’s a frankly poor 0.7% conversion rate. Almost 5,000 ad impressions per purchase (using Meta numbers with Amazon numbers, note).
Here’s a chart from Amazon showing the daily count of click-throughs:
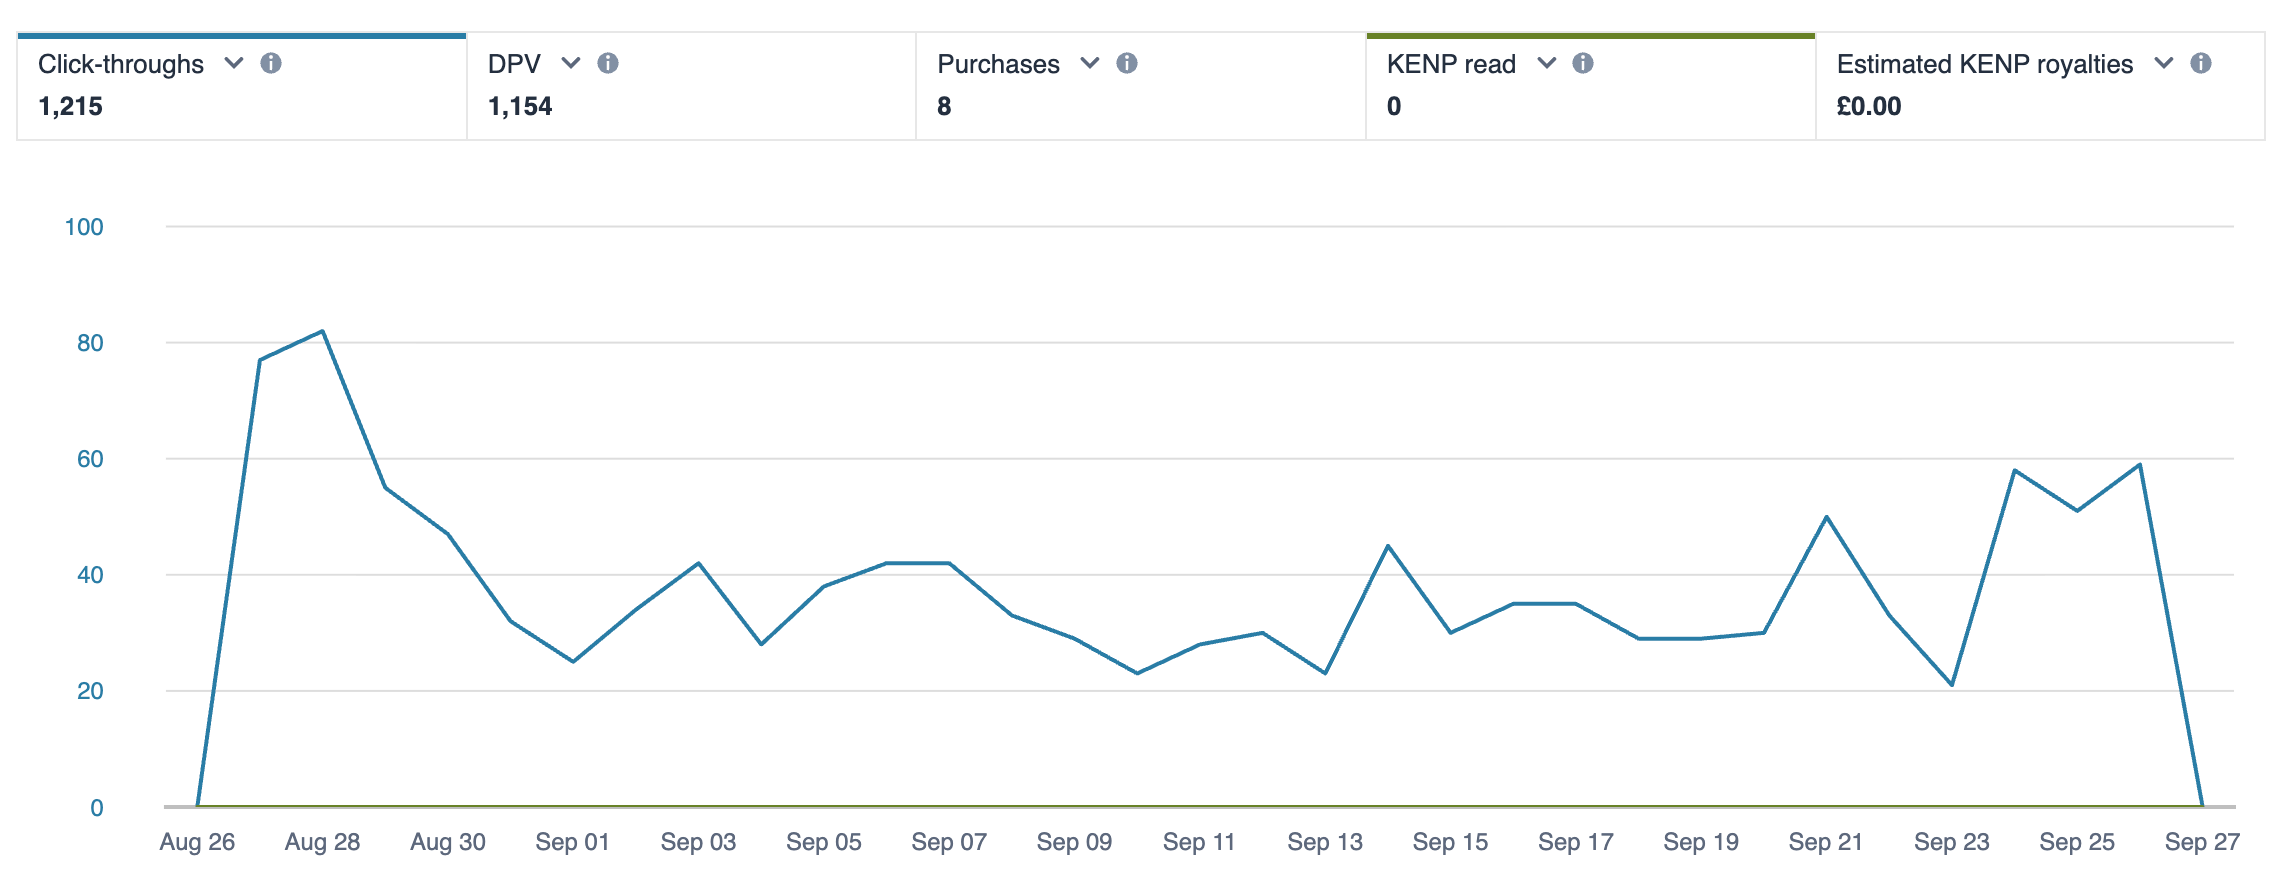
Possibly higher at the start because it was a new ad campaign. The dip and increase near the end is I suspect due to ad creative changes (see a later post).
But as I mentioned, those are the sales directly attributable to the ad click. What about other sales that occurred within the campaign period?
Here we have to fudge things a little. Can I truly say that a sale that happened to occur within a campaign period counts as a sale driven by an ad? No, not at all. But I can say that on my Amazon dashboard, sales across all my books had been zero for ten days before the start of the campaign, and so it’s reasonable to assume that sales within the campaign period were ad-related.
These sales could occur a couple of ways, such as:
- Person sees ad, and independently goes to Amazon to buy
- Person sees book high in an Amazon bestseller list (because of sales caused by ads), and decides to buy
Another side-effect of an ad for Unstable Orbits could be increased sales for my other books. I’ve decided not to count those as part of this experiment (but for reference: I sold 2 copies of other books during the campaign period).
During the campaign period, according to Amazon:
- Orders processed for Unstable Orbits: 16 (13 ebook, 3 paperback)
Which works out at a conversion rate of 1.39%. Still poor.
Here’s the daily chart:
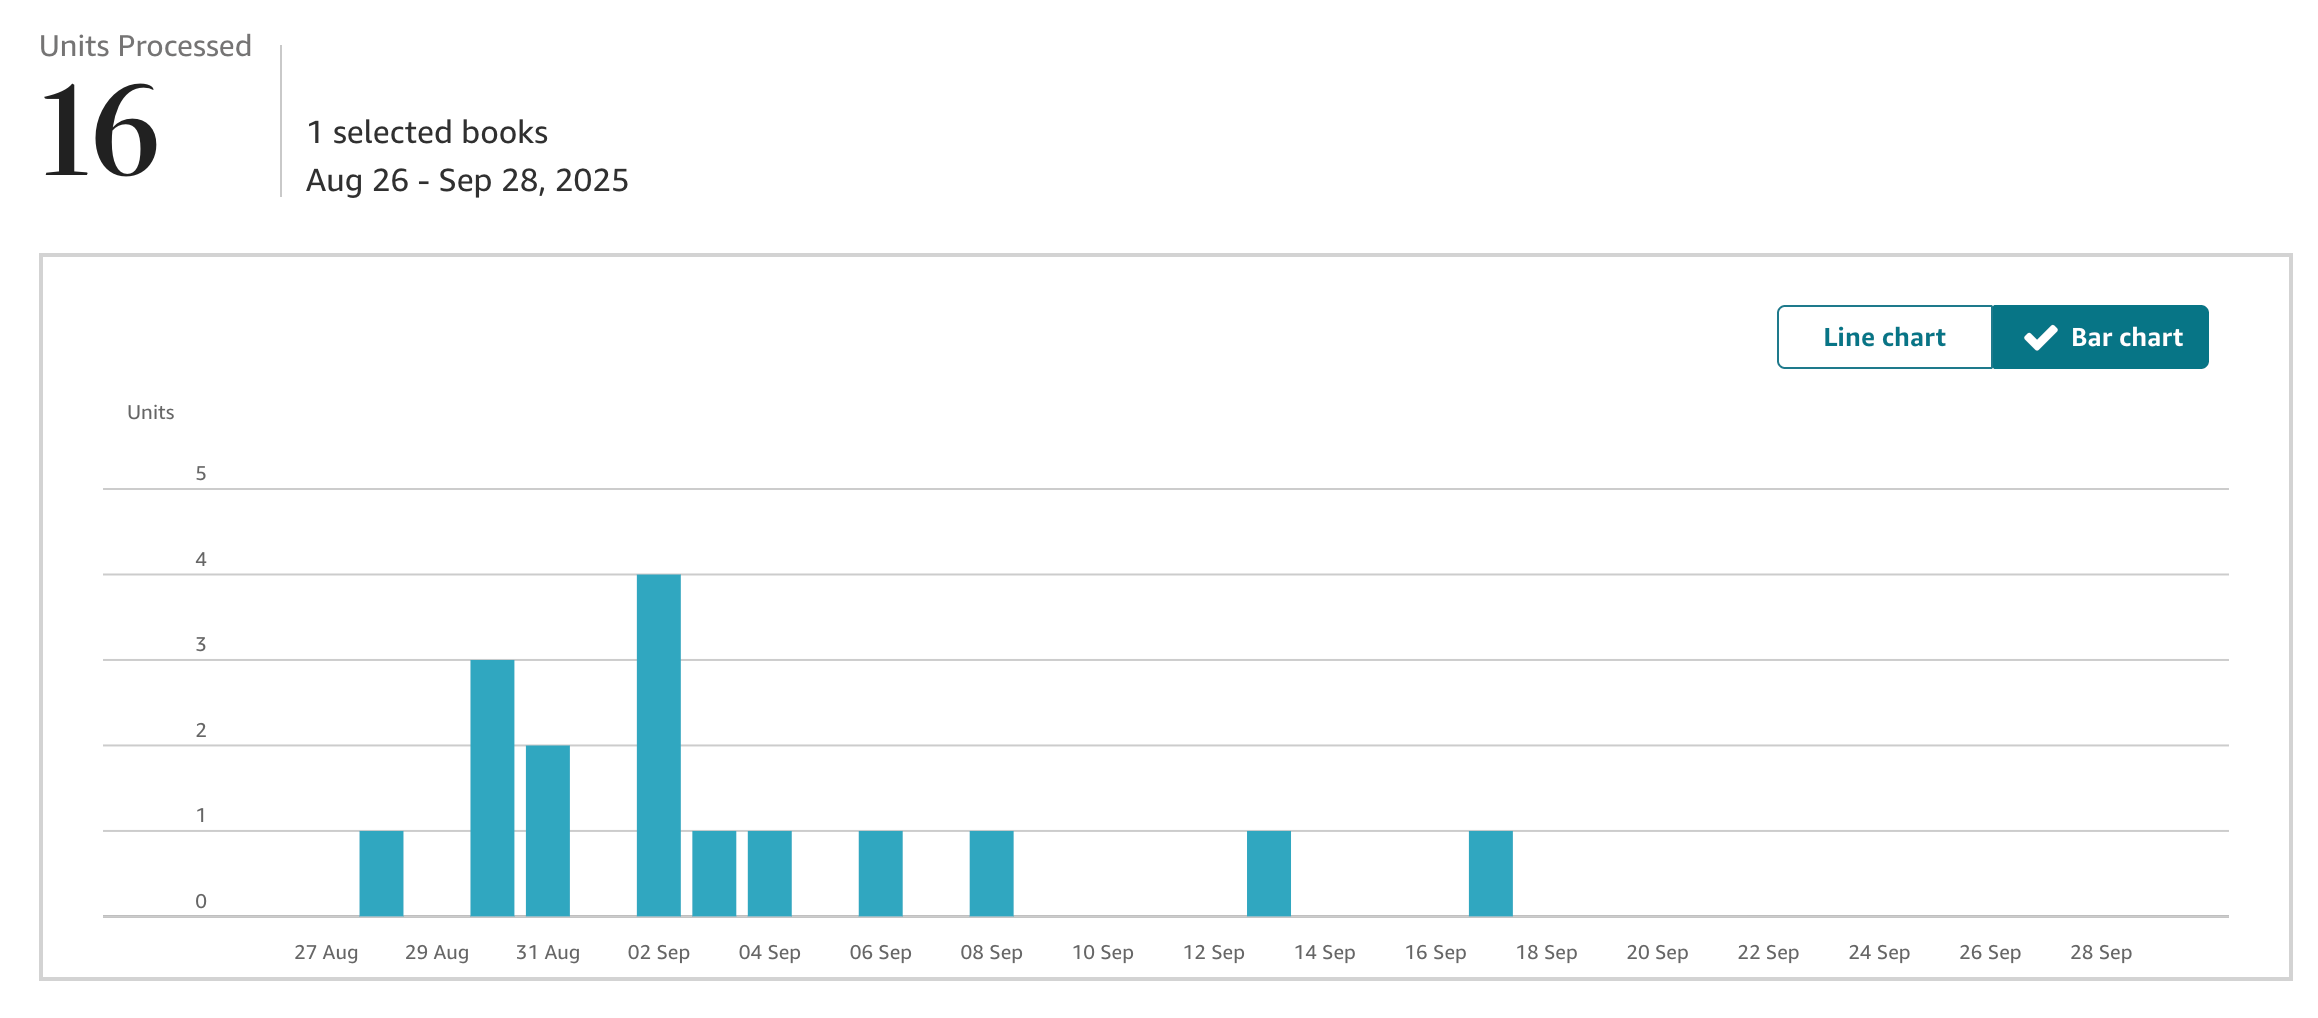
Those 16 sales result in royalties of £50.73 — a third of my ad spend. From the chart above you’ll see that I could’ve cut my losses significantly by stopping the campaign two weeks early.
Outcome
Although I made a loss, the goal wasn’t to make a profit.
Positives:
- 16 more people have a copy of Unstable Orbits. They might go on to buy my other books. They might write reviews, and recommend me to friends/enemies
- Sales were frequent enough early on to briefly lift Unstable Orbits into the top ten in a couple of bestseller lists, and possibly drive more sales
Negatives:
- It’s dangerous to draw too many conclusions from low numbers like 8 or 16
- Sales dried up after September 8, and it’s not clear why
As I suggested in my previous post, I changed the ad creatives a couple of times during the experiment. I also changed the book blurb. Those changes will likely have impacted the numbers, positively or negatively. It’s possible that the blurb change made the sales tank, but with such low numbers generally it’s impossible to tell. The change from August to September might be a stronger influence.
What’s next?
I’ll write another post looking at the ad creatives, as there are some interesting results there I think. Not sure when I’ll get round to that.
Unstable Orbits needs more reviews to help drive more sales: I’m looking at how to tackle that problem. I’m not going to buy reviews. I’ve reached out to a few popular review sites: no responses yet.
If you have any ideas, let me know in the comments!


Leave a comment